|
Using the statistics viewer, you can view this information back on to a graph.
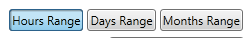
 Data Range
Select what type of time span you would like to view. Hours, Days or Months.
| |
 Data Type Drop Down
Choose what data you would like to view. Number of Hits, Duration of Interactions or Total Duration of the effect.
| |
 Compare to past
You can compare two different Time Spans on two different graphs.
| |
 Apply button
When you have selected a valid time range, click Apply to view pack the data on a Chart.
| |
 Date
Choose what date you want to view Statistics for
| |
 Start Time
Choose the start time for your graph
| |
 End Time
Choose the end time for your graph.
| |
|
|